The Physical Interface: Bringing the Lab to Life
For a while now, I’ve had a live status page for my Proxmox cluster (Starfleet), but opening a browser tab to check CPU loads feels… inefficient. I wanted something physical. Something that sits on my desk and looks like it belongs on the bridge of a sci-fi ship.
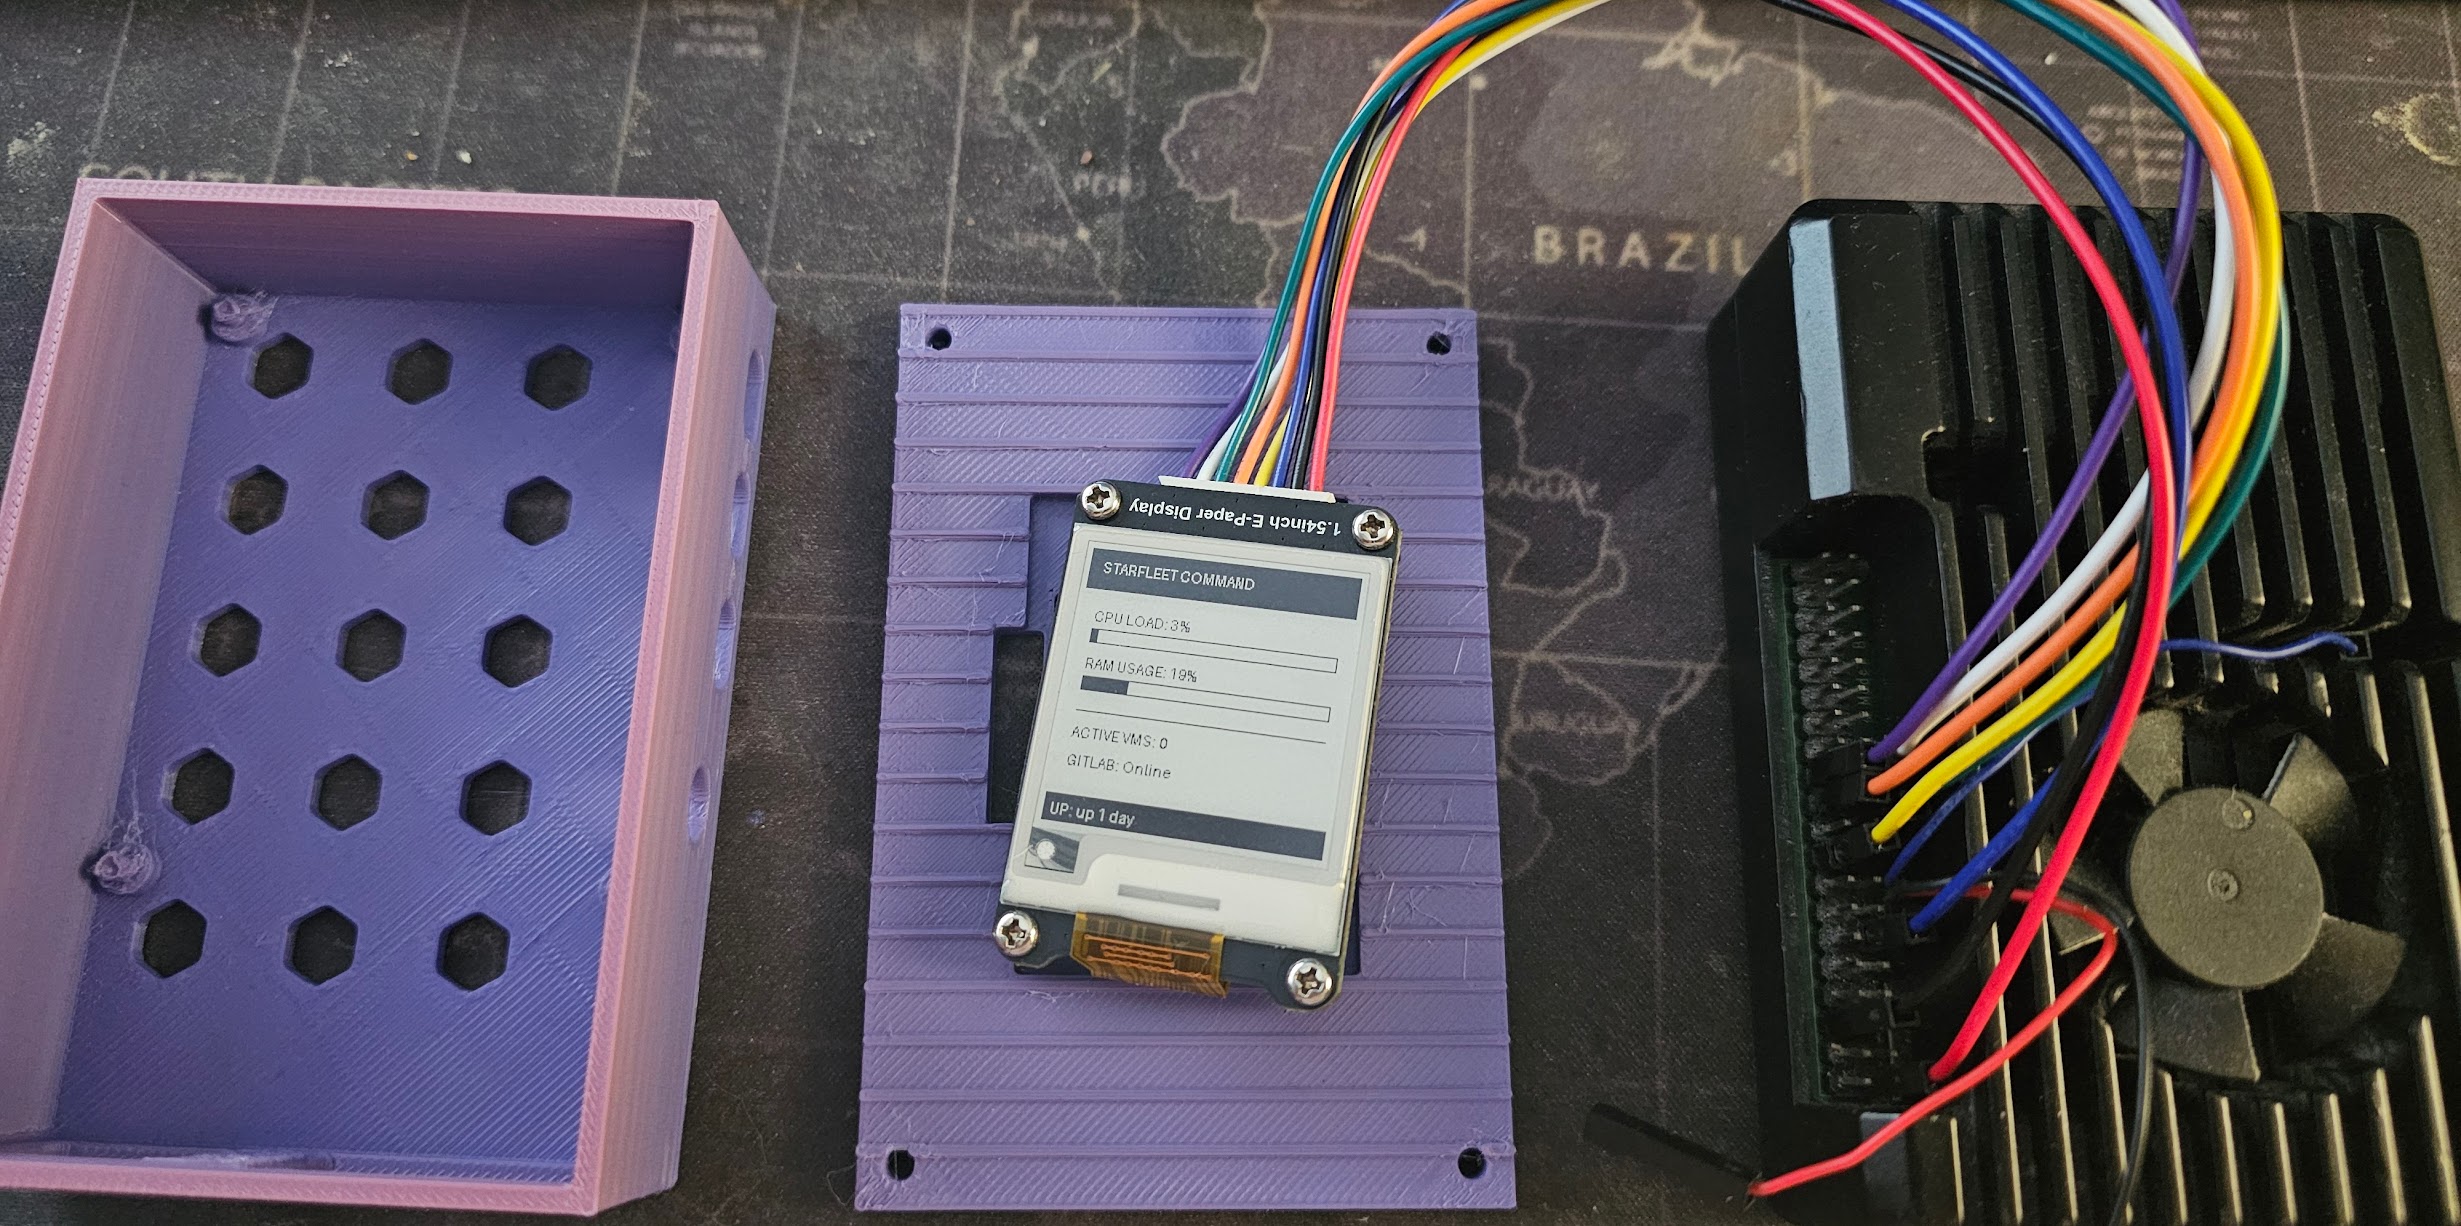
The Hardware
- Brain: Raspberry Pi 4
- Display: Xicoolee 1.54” E-Ink Module (SPI)
- Fabrication: Bambu Lab A1 Mini (waiting on the big A1!)
The Design Challenge
I decided to use OpenSCAD for the case design. If you’ve never used it, it’s “CAD for Programmers.” Instead of dragging shapes around, you write code.
The first prototype failed spectacularly. I measured the screen but forgot about the massive white JST connector on the bottom “chin” of the module. The lid wouldn’t close.
I jumped back into the code, added a connector_trench module to carve out space for the wires, and shifted the viewport.
// The fix for the bulky connector
translate([(pi_w+wall*2)/2 - 8, (pi_d+wall*2 - pcb_h)/2 - 5, -1])
    cube([16, 10, 10]); // 16mm wide trench
The Software
The Pi runs a Python script that polls my website’s status.json endpoint every 60 seconds. It uses the Pillow library to draw a UI with progress bars for CPU and RAM, then pushes it to the E-Ink screen.
The best part? Because it’s E-Ink, the image stays on the screen even if I unplug the Pi. It’s a persistent artifact of the lab’s last known state. What’s Next?
The 1.54” screen is great, but it’s a bit small for detailed logs. I’m currently looking at upgrading to a 2.9” Waveshare or the Pimoroni Inky wHAT to get more screen real estate.
Stay tuned for the STL files once I dial in the tolerances!